If your product depends on third-party APIs, "status" is part of your uptime.
The problem: status pages and incident posts change constantly. Timelines update. Root causes get revised. Mitigations appear hours later. And teams either miss important updates—or drown in noisy alerts.
This guide shows how to monitor status pages and incident updates reliably, what recent outage data tells us about why it matters, and how to keep the workflow calm with BriefPanel.
What the data shows: dependency outages are getting more expensive
Outages are not just an operational headache—they are a growing financial risk, and the cost is concentrating in the rare but severe events.
- In the Uptime Institute's Annual Outage Analysis 2024, 54% of operators said their most recent significant outage cost more than $100,000, and roughly one in five reported costs above $1 million. Notably, the report found outages are becoming less frequent but more expensive—driven by the increasingly critical nature of digital services, SLA penalties, and longer recovery times.
- The July 2024 CrowdStrike update failure is a textbook dependency cascade. A single faulty sensor update grounded flights and froze checkouts worldwide; an analysis by Parametrix reported by Fortune estimated about $5.4 billion in direct losses for Fortune 500 companies, with healthcare (
$1.94B) and banking ($1.15B) hit hardest—and the vast majority of those losses uninsured. - The October 20, 2025 AWS
us-east-1outage showed how a tiny defect in one provider ripples across the internet. As The Register reported, a DNS race condition in DynamoDB's automated management left the regional endpoint pointing at no IP addresses, cascading into EC2, Lambda, and Fargate failures and taking roughly 15 hours to fully resolve. Snapchat, Reddit, Coinbase, and many others went down with it.
The lesson for reliability teams: you don't control your vendors' uptime, but you can control how fast you learn about it. The teams that recover fastest tend to detect and triage first. In Google's 2024 DORA report, elite performers restore service after a failed change in under one hour—a bar that's nearly impossible to hit if you find out about a dependency incident from your own customers.
What changes during an incident
Incident pages evolve in phases:
- initial acknowledgement and scope
- status transitions (investigating → identified → monitoring)
- impact updates (regions, services, severity)
- mitigation steps
- resolution notes
- postmortem additions (root cause, corrective actions)
If you only catch the first ping, you miss the most useful updates. As Atlassian notes in its incident communication best practices, the most valuable updates are often the substantive revisions—scope changes, ETAs, and the eventual root-cause writeup—not the initial "we're investigating" notice.
What to monitor
For each vendor, consider monitoring:
- status dashboard (the live "all systems operational" page)
- incident history page — in BriefPanel this can be one source: each incident is an entry, and a check can follow each incident's own page to read its updates
- individual incident URLs (high-impact ones you want on their own)
- postmortem / RCA pages (if separate)
- SLA / support policy pages (sometimes quietly updated after major events)
A practical rule of thumb: build a dependency map of every external service in your critical request path—auth providers, payment processors, CDNs, cloud regions, email/SMS gateways—then attach the right status URL to each. Most run on hosted platforms like Atlassian Statuspage, so the page structure is predictable and easy to watch.
The main approaches
1) Email/SMS from status providers
Helpful, but often too noisy or too high-level. You get a notification, but rarely a clear "what changed since last time."
2) Chat notifications
Fast, but can overwhelm channels during multi-hour incidents—exactly when signal matters most.
3) RSS / Atom feeds
Many Statuspage-style pages expose them, but coverage is inconsistent and feeds often don't capture edits to an existing update.
4) Website change monitoring
Works well for watching exact incident URLs and status dashboards, including pages without a feed.
The remaining problem is interpretation: out of a wall of newly-changed text, what changed and what matters now?
An incident-monitoring framework that avoids alert fatigue
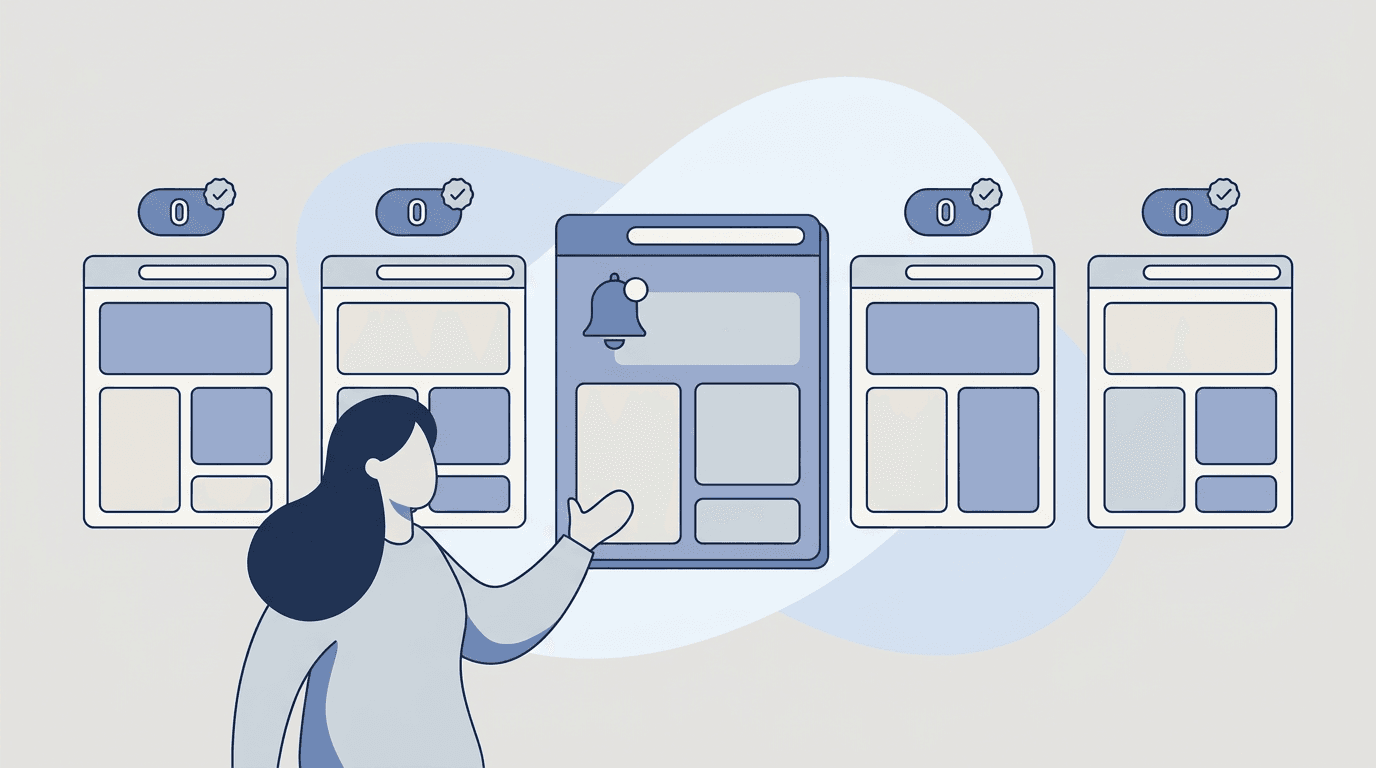
Alert fatigue is a real reliability risk—when everything pages, nothing gets read. A tiered approach keeps the signal high:
- Tier your vendors. Tier 1 = an outage breaks your product (auth, payments, primary cloud region). Tier 2 = degraded but survivable. Tier 3 = nice-to-have. Match your monitoring cadence to the tier.
- Match cadence to blast radius. Check Tier 1 status pages every 30 minutes (the fastest option in BriefPanel); Tier 2 every hour or every 6 hours; Tier 3 every 24 hours. There's no value in 30-minute checks on a vendor whose outage you'd shrug off — and each check costs a credit per page it reads.
- Summarize the delta, not the page. During a long incident the page changes many times. What on-call needs is "what's new since the last update"—new affected regions, a fresh ETA, a mitigation step—not the full text again.
- Alert on Tier 1, quiet the rest. Tier 1 incidents deserve a real alert. Lower tiers should interrupt less: check them less often so they produce fewer updates, and keep the lowest tier in a history you open when you need it.
- Capture the postmortem. The root-cause writeup is the most valuable artifact for your own resilience planning—and it often lands days later, long after everyone stopped watching.
The workflow upgrade: monitoring + typed incident fields
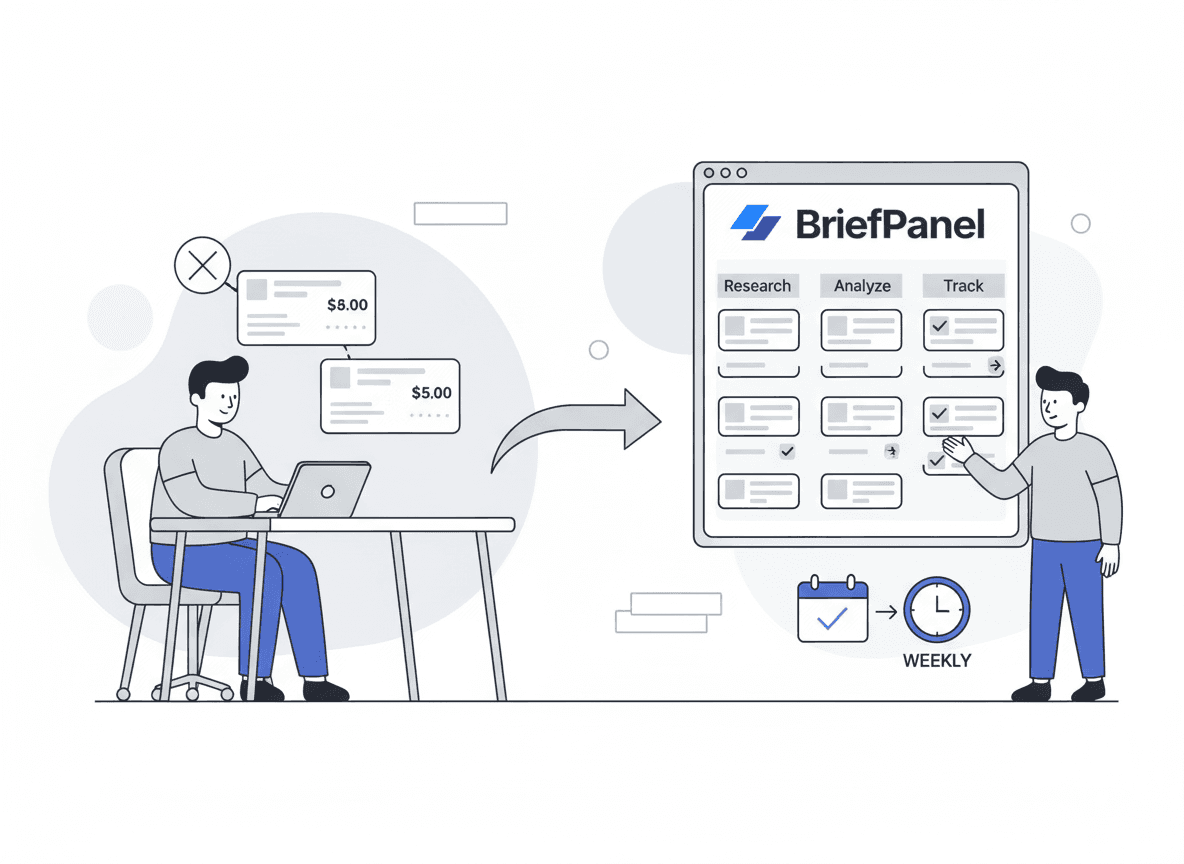
BriefPanel watches the public status and incident URLs you care about and tracks each incident as its own item, telling you which field moved:
- the field that moved, with its previous and current value
- the new impact scope (services / regions / severity)
- what actions or mitigations were added
BriefPanel has no severity filter, so you route by source:
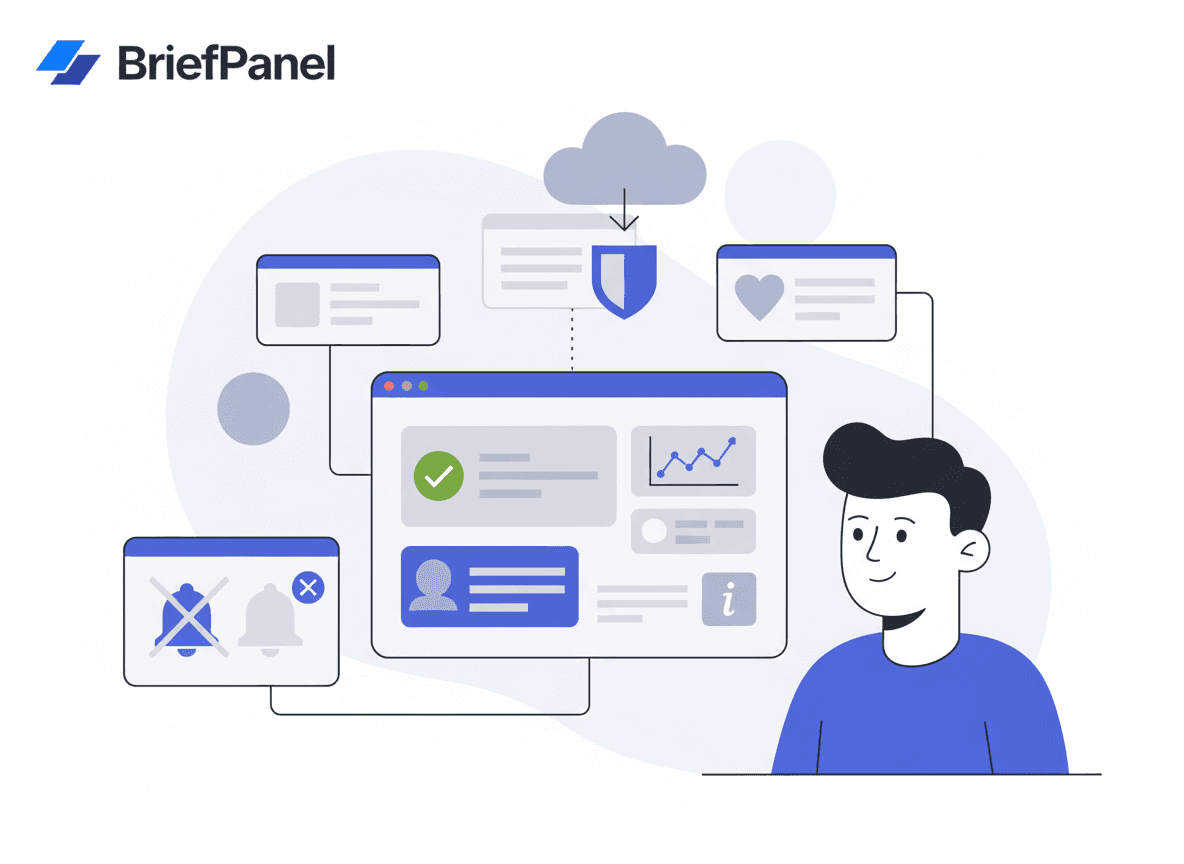
- Tier 1 sources keep notifications on. Changes reach you by instant email (at most one per interval you choose), push, or a Slack or Discord channel through a webhook.
- Lower-tier sources can have notifications turned off in their settings. Their history stays in the app for when you need it.
- The daily digest recaps every source that still has notifications on, in your app language.
- Inside a source, the instructions, Update Sensitivity, and "Don't show updates like this" cut repeat noise.
To feed on-call tooling, signed outbound webhooks send a POST for each new, modified, or removed incident, and the REST API and MCP server read the same history. (BriefPanel monitors publicly accessible pages.)
Want incident updates you can scan in seconds? See how BriefPanel tracks vendor docs and status pages →
Prompt template: status and incident monitoring
Use a per-URL prompt like this:
"Track incident status, impact scope, affected services/regions, mitigation steps, ETAs, and resolution notes. Flag anything that affects authentication, payments, or data availability. Ignore navigation, footer, and unrelated page elements."
A calm setup
- Monitor your top 10–30 vendors, tiered by blast radius.
- Set the default cadence to every 24 hours.
- For Tier 1 vendors, check every 30 minutes (the fastest option) or every hour.
- Keep notifications on for Tier 1 sources. Turn them off for the lowest tiers and open their history in the app when you need it; muted sources stay out of alerts and the digest.
- Add postmortem/RCA pages so you capture the root cause when it lands.
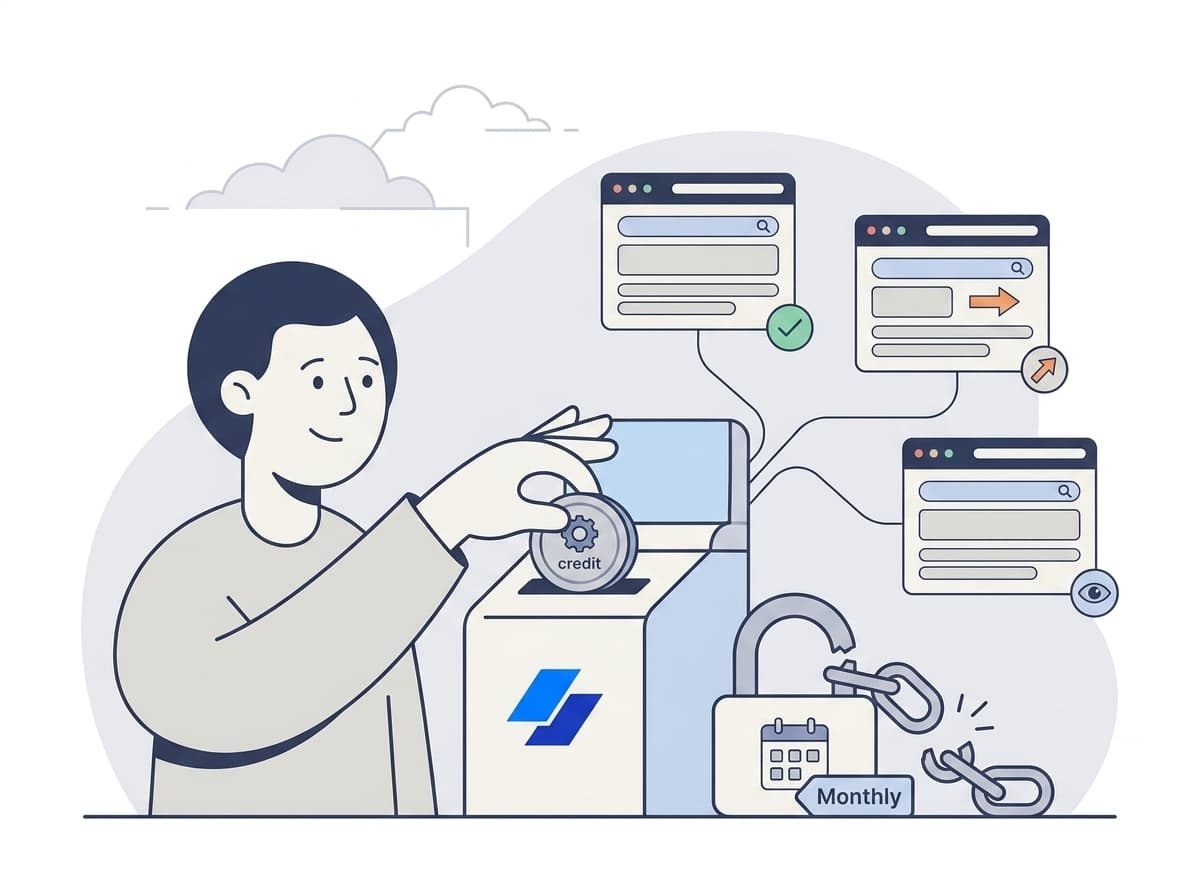
Watch the cost. A check spends one credit for every page it reads (the status page plus any incident pages it follows), up to a fixed ceiling. Thirty vendors checked every 30 minutes add up fast, so keep the fastest cadence for Tier 1. A paused source spends nothing, and each source's settings show what one check costs.
FAQ
How is monitoring a status page different from uptime monitoring? Uptime monitoring (pinging an endpoint) tells you whether your own service responds. Status-page monitoring tells you what your dependencies are reporting—often with context (root cause, affected regions, ETA) you can't infer from a failed ping alone. The two are complementary.
Why not just subscribe to each vendor's email/SMS alerts? You can, and you should for your most critical few. But across 20–30 vendors, native alerts become noise, arrive in inconsistent formats, and rarely highlight what changed in an ongoing incident. A summarized, tiered feed scales better.
How often should I check a status page during an incident? Match it to blast radius. For a Tier 1 dependency in an active incident, every 30 minutes (the fastest option in BriefPanel) captures meaningful revisions without overwhelming on-call. Lower tiers can stay at every hour, 6 hours, or 24 hours.
Can I monitor pages that don't publish an RSS feed? Yes. Website change monitoring watches the rendered page directly, so you're not dependent on the vendor exposing a feed—useful for status dashboards and postmortem pages that only update the HTML.
What about SLA and support-policy pages? Vendors sometimes revise SLA terms or credits after a major incident. Watching those pages means you learn about changes to your contractual protection without manually re-reading legal copy.
Related guides
- Top 10 ways to track website changes
- Track competitor pricing changes
- Monitor competitor pricing and packaging
- Competitive intelligence for product managers
Start monitoring incident updates without the noise
Most teams don't need more pings.
They need to know exactly which field moved when something important changes.
Sources
- Uptime Institute — Annual Outage Analysis 2024
- Fortune — CrowdStrike outage to cost Fortune 500 companies $5.4 billion (2024)
- The Register — A single DNS race condition brought AWS to its knees (Oct 2025)
- Google — 2024 DORA / Accelerate State of DevOps Report (PDF)
- Atlassian — Incident communication best practices